Step by Step Guide to Spot and Resolve Hanging Workflows
Who this is for: Ops engineers, platform maintainers, and advanced n8n users who run production‑grade workflows and need reliable detection and remediation of long‑running or hanging executions. We cover this in detail in the n8n Production Failure Patterns Guide.
What Are You Seeing? – Identify Your Symptom First
Before diving into fixes, identify which stuck state you’re dealing with. The two look similar in the UI but have completely different root causes and fix paths.
| What you see in the UI | What it actually means | Most likely cause | Jump to |
|---|---|---|---|
| Queued / “Starting soon” — never starts | Execution entered the queue but no worker picked it up | No worker running, concurrency limit hit, or Redis ghost job | Section 1A |
| Running — no progress, never finishes | Execution started but a node is blocking indefinitely | API timeout, infinite loop, DB deadlock, OOM | Section 1B + Quick Diagnosis |
| Running after restart — stale row in DB | n8n crashed mid-execution; DB row never got updated to error | Container crash, OOM kill, forced restart | Section 1C (SQL fix) |
| Manual run works, production queue doesn’t | Worker process is down; manual executions bypass the queue | EXECUTIONS_MODE=queue but worker container crashed | Section 1A |
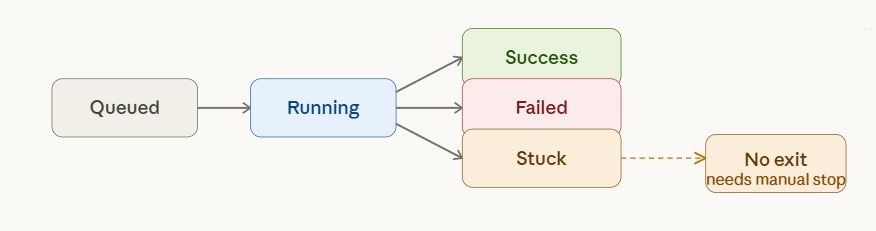
n8n stuck executions detection
1A. Executions Stuck in “Queued / Starting Soon” – Queue Mode Fixes
This is the most common stuck-execution scenario in self-hosted n8n. When EXECUTIONS_MODE=queue is set, every triggered execution enters a Bull queue in Redis and waits for a worker process to pick it up. If that worker is missing, offline, or saturated — every execution stays in “Queued” forever.
Root Cause 1: No Worker Process Running
Symptom: All executions immediately show “Queued” and never transition to “Running”. Manual test runs in the editor also queue up instead of executing.
Why it happens: You set EXECUTIONS_MODE=queue in your .env or docker-compose.yml, but forgot to start the worker container. The main n8n container in queue mode does not execute workflows — it only enqueues them. A separate worker process with the worker command is required.
Diagnosis:
# Check if any n8n worker containers are running
docker ps | grep n8n

# You should see a container running the 'worker' command.
# If you only see the main n8n container — that's your problem.
Fix: add a worker service to your docker-compose.yml:
n8n-worker:
  image: docker.n8n.io/n8nio/n8n
  command: worker
  restart: unless-stopped
  environment:
    - EXECUTIONS_MODE=queue
    - QUEUE_BULL_REDIS_HOST=redis
    - QUEUE_BULL_REDIS_PORT=6379
    - DB_TYPE=postgresdb
    - DB_POSTGRESDB_HOST=postgres
    - DB_POSTGRESDB_DATABASE=${POSTGRES_DB}
    - DB_POSTGRESDB_USER=${POSTGRES_USER}
    - DB_POSTGRESDB_PASSWORD=${POSTGRES_PASSWORD}
    - N8N_ENCRYPTION_KEY=${N8N_ENCRYPTION_KEY}
    - N8N_CONCURRENCY_PRODUCTION_LIMIT=10
    - N8N_GRACEFUL_SHUTDOWN_TIMEOUT=300
  volumes:
    - n8n_storage:/home/node/.n8n
  depends_on:
    - redis
    - postgres
    - n8n
After adding this, run docker compose up -d n8n-worker. Within seconds, queued executions will start being picked up.
Root Cause 2: Concurrency Limit Hit (Queue Flood)
Symptom: n8n was working fine, then after a webhook burst or a long-running batch job, all new executions stack up as “Queued”. The worker is running but not picking up new jobs.
Why it happens: N8N_CONCURRENCY_PRODUCTION_LIMIT caps how many executions a worker runs simultaneously. Default is 10. If 10 long-running jobs are active, the 11th sits in the queue indefinitely — including short 1-second workflows.
Diagnosis:
# Count actively running executions via the API
curl -s "https://YOUR_N8N_INSTANCE/api/v1/executions?status=running&limit=100" \
  -H "Authorization: Bearer YOUR_API_KEY" | jq '.data | length'

# If this returns 10 (or your limit value) — you've hit the cap.
Fix — scale concurrency or add more workers:
# Option A: Increase concurrency on existing worker (watch CPU/RAM)
N8N_CONCURRENCY_PRODUCTION_LIMIT=25

# Option B: Add a second worker container (recommended for production)
# Duplicate the n8n-worker service in docker-compose.yml as n8n-worker-2
# Both workers share the same Redis queue — load is distributed automatically

# Option C: Emergency — stop the long-running jobs blocking the queue
curl -X POST "https://YOUR_N8N_INSTANCE/api/v1/executions/EXECUTION_ID/stop" \
  -H "Authorization: Bearer YOUR_API_KEY"
Root Cause 3: Redis Ghost Jobs (Locked Bull Queue Entries)
Symptom: Executions are stuck in “Queued” even after restarting the worker. Restarting the main n8n container doesn’t help. The queue keeps growing.
Why it happens: When an execution is manually stopped or a worker crashes mid-job, the Bull queue entry in Redis can remain in a locked or “active” state. Future executions pile up behind these ghost entries. The worker sees the ghost job as still active and won’t process new ones.
Diagnosis – inspect the Bull queue in Redis:
# Connect to your Redis container
docker exec -it redis redis-cli

# List all Bull queue keys
KEYS bull:*

# Check active (locked) jobs count
LLEN bull:jobs:active

# Check waiting jobs
LLEN bull:jobs:wait
Fix – flush the stuck Bull jobs:
# ⚠️ WARNING: This clears ALL pending queue entries. Only do this if executions
# are already stuck and you accept losing the queued jobs.

# Option A: Flush only Bull queue keys (targeted — recommended)
docker exec -it redis redis-cli --scan --pattern 'bull:*' | xargs docker exec -i redis redis-cli DEL

# Option B: Nuclear — flush the entire Redis DB (use only if n8n is the sole Redis user)
docker exec -it redis redis-cli FLUSHDB

# After flushing, restart the worker:
docker compose restart n8n-worker
Note for n8n Cloud users: You don’t have direct Redis access on n8n Cloud. If executions are stuck in “Queued / Starting soon”, the fix is to contact n8n support via the in-app chat. You can also try deactivating and re-activating the affected workflow, which forces new queue registrations.
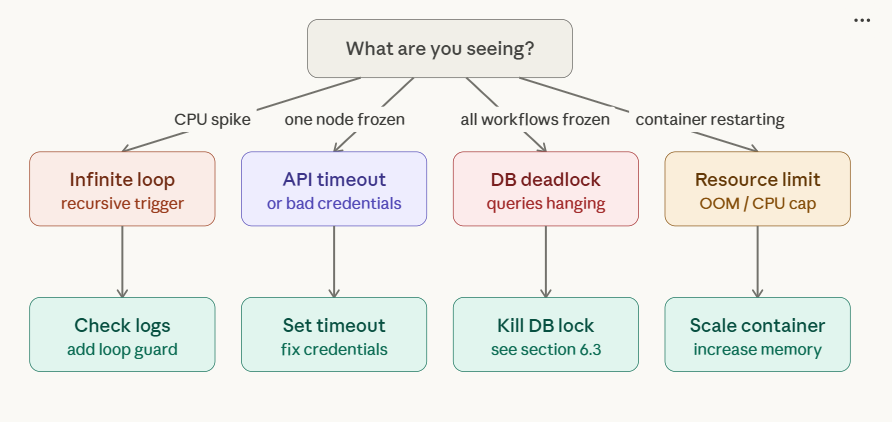
Root cause decision tree
1B. Executions Stuck in “Running” – What’s Actually Happening
Once an execution transitions from “Queued” to “Running”, it is actively being processed by a worker. If it stays in “Running” indefinitely without completing or erroring, a node somewhere is blocking. The Quick Diagnosis section below covers how to detect and stop these. The root causes are in Section 1 (Why Executions Get Stuck).
1C. Stale “Running” Rows After a Crash – Direct Database Fix
Symptom: After restarting n8n (or after a container OOM kill), some executions are permanently stuck in “Running” in the UI. They can’t be stopped via the UI or the API because the underlying process is already dead — only the DB row is stale.
Why it happens: When n8n crashes mid-execution, it doesn’t get the chance to write the final error or success status to the database. The row stays as running forever.
Fix – direct SQL update (PostgreSQL):
-- Connect to your n8n PostgreSQL database
-- Step 1: See all stale running rows
SELECT id, "workflowId", "startedAt", status
FROM execution_entity
WHERE status = 'running'
ORDER BY "startedAt" ASC;

-- Step 2: Force-mark them all as error
-- ⚠️ Do this only after confirming no legitimate executions are running
UPDATE execution_entity
SET status = 'error',
    "stoppedAt" = NOW()
WHERE status = 'running';
Fix – direct SQL update (SQLite):
-- Connect to your SQLite DB (default path: /home/node/.n8n/database.sqlite)
sqlite3 /home/node/.n8n/database.sqlite

-- See stale rows
SELECT id, workflowId, startedAt, status FROM execution_entity WHERE status = 'running';

-- Force-close them
UPDATE execution_entity SET status = 'error', stoppedAt = datetime('now') WHERE status = 'running';
After the SQL fix: Refresh the n8n UI. The “Running” entries will now show as “Error”. This is purely a display fix — it does not restart those executions. If you need them to re-run, trigger them manually after confirming the underlying issue (OOM, crash) is resolved.
1D. Queue Mode Environment Variables: Cheatsheet
Misconfigured environment variables are responsible for the majority of stuck-execution reports. Here is every relevant variable with the correct values for a production queue-mode setup.
| Variable | Recommended value | What happens if wrong |
|---|---|---|
EXECUTIONS_MODE |
queue |
If set to regular on worker, worker ignores the Redis queue |
QUEUE_BULL_REDIS_HOST |
Redis container name (e.g. redis) |
Worker can’t connect to queue; all jobs stay Queued |
QUEUE_BULL_REDIS_PORT |
6379 |
Connection refused; queue stalls |
QUEUE_HEALTH_CHECK_ACTIVE |
true |
Worker silently drops if Redis goes down; no alert fired |
N8N_CONCURRENCY_PRODUCTION_LIMIT |
10 (increase for high-throughput) |
Too low → queue floods on bursts; too high → OOM on worker |
N8N_GRACEFUL_SHUTDOWN_TIMEOUT |
300 (seconds) |
Too low → worker kills running jobs on deploy, creating ghost DB rows |
OFFLOAD_MANUAL_EXECUTIONS_TO_WORKERS |
true (optional) |
If false, manual runs bypass queue (useful for debugging but inconsistent behavior) |
N8N_RUNNERS_ENABLED |
true |
Required for task runners; without it, Code nodes may stall executions |
QUEUE_PROCESS_TIMEOUT |
420000 (ms = 7 min) |
Too low → executions cancelled mid-run with “The execution was cancelled” error |
Quick Diagnosis
Problem: An execution stays in Running far beyond its normal duration (e.g., waiting on an external API, infinite loop, or node timeout).
Step 1 – Pull IDs of executions older than the expected max runtime (5 min)
curl -s "https://YOUR_N8N_INSTANCE/api/v1/executions?status=running&limit=100" \
     -H "Authorization: Bearer YOUR_API_KEY" |
jq '.data[] | select(.startedAt | fromdateiso8601 < (now - 300)) | .id' \
> stuck_ids.txt
The command queries the n8n API, filters executions that started more than 300 seconds ago, and writes their IDs to a file.
Step 2 – Bulk‑stop the identified executions
while read id; do
  curl -X POST "https://YOUR_N8N_INSTANCE/api/v1/executions/$id/stop" \
       -H "Authorization: Bearer YOUR_API_KEY"
done < stuck_ids.txt
Run the two‑step script as a cron job (or inside an n8n “Cron” node) to clean up stuck executions every 5 minutes.
1. Why Executions Get Stuck in n8n?
If you encounter any n8n production bugs not reproducible resolve them before continuing with the setup.
| Root Cause | Typical Symptom |
|---|---|
| External API timeout | Node waits > timeout, never returns |
| Infinite loop / recursive trigger | CPU spikes, logs flood |
| Node‑specific bug (e.g., bad credentials) | Node silently fails, no error |
| Database deadlock | DB queries hang, other executions pause |
| Resource limits (memory/CPU) | Container OOM, pod restarts |
How n8n shows it: The execution remains Running in the UI with no error node.
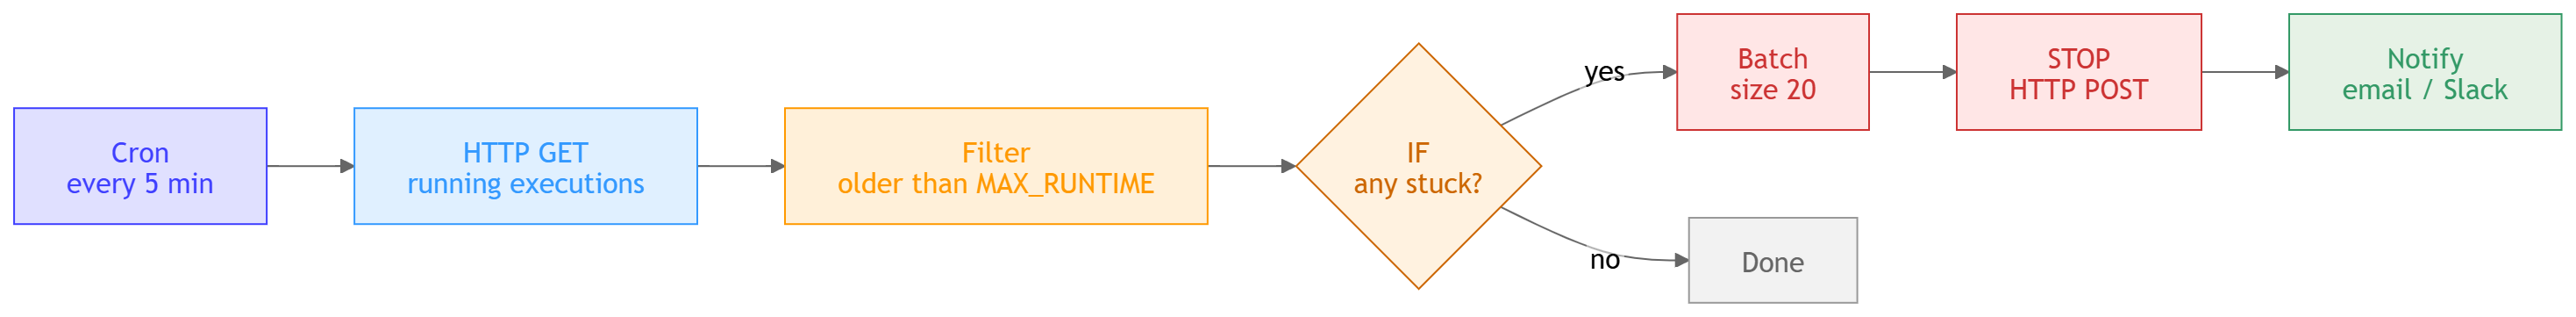
The detector workflow diagram
2. Native n8n Tools for Detecting Stuck Executions
2.1 Execution List + Filters (UI)
- Open Executions → filter Status = Running.
- Sort by Started At descending.
- Spot entries older than the workflow’s average runtime.
Limitation: Manual and not scalable for many workflows.
2.2 Execution Statistics (Built‑in Metrics)
When METRICS_ENABLED=true, n8n serves a Prometheus‑compatible /metrics endpoint.
Metric to watch
n8n_executions_running{workflowId=""} <count>
Minimal Prometheus alert rule (split for readability)
# 1️⃣ Detect any running execution
- alert: n8nStuckExecution
  expr: n8n_executions_running > 0
  for: 2m
# 2️⃣ Check how long the oldest running execution has been alive
  expr: (time() - max by (workflowId)
        (n8n_execution_started_timestamp{status="running"})) > 300
  labels:
    severity: warning
EEFA note: Enabling metrics adds a small CPU overhead; monitor container resources after activation.
2.3 Execution Webhooks (Beta)
n8n can emit a webhook on execution.finished and execution.failed. If a *finished* webhook does not arrive within a configurable timeout, treat the execution as stuck. If you encounter any n8n race conditions parallel executions resolve them before continuing with the setup.
{
  "event": "execution.finished",
  "workflowId": 42,
  "executionId": "1234",
  "timestamp": "2024-01-09T12:00:00Z"
}
Implementation tip: Pair the webhook with a lightweight “heartbeat” endpoint that a Cron node polls; missing heartbeats flag the execution as stuck.
3. Building a Dedicated “Stuck‑Execution Detector” Workflow
3.1 High‑Level Architecture
- Cron (every 5 min) → HTTP Request (GET running executions)
- Function – filter executions older than
MAX_RUNTIME(default 300 s) - IF – if any IDs → SplitInBatches (size 20) → HTTP Request (POST stop)
- Notify – send a summary via Email or Slack
3.2 Workflow Snippets (4‑5 lines each)
Cron node – schedule the check
{
  "name": "Cron – Check Stuck",
  "type": "n8n-nodes-base.cron",
  "parameters": {
    "triggerTimes": { "mode": "everyX", "everyX": 5, "unit": "minutes" }
  }
}
HTTP request – fetch running executions
{
  "name": "GET Running Executions",
  "type": "n8n-nodes-base.httpRequest",
  "parameters": {
    "url": "https://{{ $env.N8N_HOST }}/api/v1/executions?status=running&limit=200",
    "responseFormat": "json",
    "options": { "headers": { "Authorization": "Bearer {{$env.N8N_API_KEY}}" } }
  }
}
Function node – keep only executions older than MAX_RUNTIME
{
  "name": "Filter Stuck Executions",
  "type": "n8n-nodes-base.function",
  "parameters": {
    "functionCode": "const MAX_RUNTIME = 300; // seconds\nconst now = Date.now();\nreturn items.filter(item => {\n  const started = new Date(item.json.startedAt).getTime();\n  return (now - started) / 1000 > MAX_RUNTIME;\n}).map(item => ({ json: { executionId: item.json.id } }));"
  }
}
SplitInBatches – avoid API rate limits
{
  "name": "SplitInBatches",
  "type": "n8n-nodes-base.splitInBatches",
  "parameters": { "batchSize": 20 }
}
HTTP request – stop each stuck execution
{
  "name": "Stop Execution",
  "type": "n8n-nodes-base.httpRequest",
  "parameters": {
    "url": "https://{{ $env.N8N_HOST }}/api/v1/executions/{{$json.executionId}}/stop",
    "method": "POST",
    "responseFormat": "json",
    "options": { "headers": { "Authorization": "Bearer {{$env.N8N_API_KEY}}" } }
  }
}
Notification – email ops team
{
  "name": "Notify Ops",
  "type": "n8n-nodes-base.emailSend",
  "parameters": {
    "toEmail": "ops@example.com",
    "subject": "n8n – Stuck Executions Auto‑Terminated",
    "text": "The following executions were stopped because they exceeded the max runtime of {{=$env.MAX_RUNTIME}} seconds:\n{{=$json.executionId}}"
  }
}
EEFA notes
- Rate‑limit safety: n8n API defaults to 60 req/min per user. A batch size of 20 with a 5‑minute interval stays well below this limit.
- Idempotency: Stopping an already‑finished execution returns 404; the workflow tolerates it.
- Security: Store
N8N_API_KEYin environment variables; never hard‑code credentials.
3.3 Deploy & Test
- Import the JSON snippets into n8n and activate the workflow.
- Run a manual execution to verify that only IDs older than
MAX_RUNTIMEare stopped. - Confirm in the Execution List that no *Running* entries older than 5 minutes remain.
4. External Monitoring Options (When n8n Native Is Not Enough)
| Tool | Integration Method | Pros | Cons | Typical Alert Condition |
|---|---|---|---|---|
| Prometheus + Grafana | Scrape /metrics; alert rule (see §2.2) |
Powerful query language; visual dashboards | Requires separate infra | execution_running_seconds > 300 |
| Datadog APM | Agent monitors HTTP calls to n8n API | Unified observability suite | Paid tier | “Stuck execution count > 0 for 2 min” |
| ELK Stack | Ship execution.log via Filebeat; query for long‑running IDs |
Centralized log search | High log volume | “log contains `status=running` and timestamp > 5 min” |
| PagerDuty (via webhook) | n8n execution webhook → PagerDuty incident | Immediate on‑call response | Extra webhook maintenance | Missing *finished* webhook after timeout |
EEFA tip: When adding a third‑party collector, ensure the n8n container’s network policy permits outbound traffic to the collector; otherwise alerts never fire.
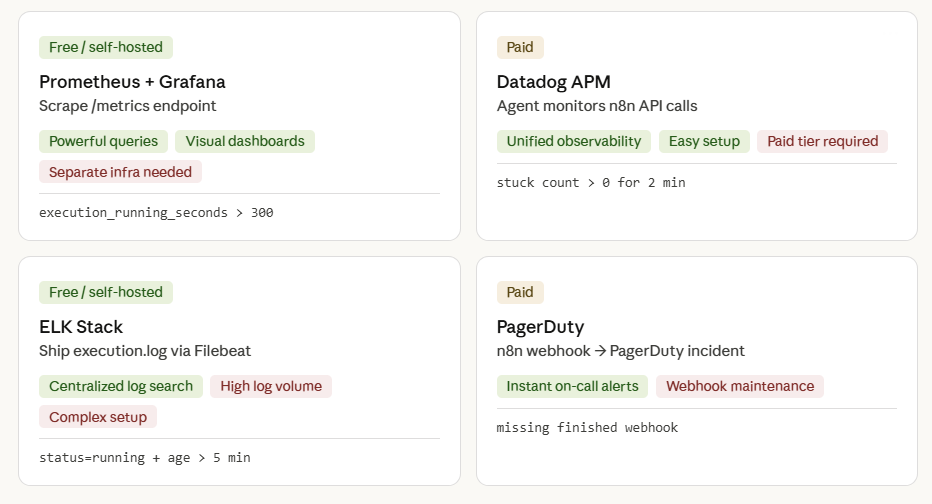
Monitoring Dashboards (Prometheus, Grafana, Datadog APM, ELK Stack, PagerDuty)
5. Checklist – Ongoing Stuck‑Execution Prevention
| Item | Why It Matters | Implementation |
|---|---|---|
| Define a realistic MAX_RUNTIME per workflow | Prevents false positives | Store in workflow env var MAX_RUNTIME |
Enable n8n metrics (METRICS_ENABLED=true) |
Powers Prometheus alerts | Add to .env and restart |
| Set up execution‑finished webhook | Guarantees you’re notified of completions | Configure webhook URL in n8n settings |
| Deploy the “Stuck Detector” workflow (see §3) | Automated remediation | Schedule every 5 min |
| Add Slack/Email alerting | Teams see problems instantly | Use n8n “Slack” node or external service |
| Review API rate‑limits | Avoid throttling when many executions stop | Keep batch size ≤ 20, interval ≥ 5 min |
| Test in staging | Confirms detection logic before production | Run a deliberately hung workflow |
| Document each workflow’s typical runtime | Makes thresholds easier to maintain | Add a comment in the workflow description |
6. Advanced Troubleshooting Scenarios
6.1 False Positive – Long‑Running but Healthy
Symptom: Execution stays “Running” for > 10 min, but it’s a legitimate batch job.
Fix:
- Add a Set node that writes a hidden flag
isLongRunning = trueinto the execution data. - Extend the detector’s filter function to ignore IDs where
isLongRunningis set.
6.2 API Authentication Failure
Symptom: Detector workflow receives 401 on /executions calls.
Fix:
- Verify the API key includes
execution:readandexecution:stopscopes. - Rotate the key and update the
N8N_API_KEYenvironment variable.
6.3 Database Deadlock Causing Global Hang
Symptom: All workflows freeze; metrics show n8n_executions_running spikes.
Fix:
- Pause the “Stuck Detector” to stop additional API traffic.
- Connect to the DB (Postgres example) and run:
SELECT * FROM pg_locks WHERE NOT granted;
- Identify the blocking PID and terminate it:
SELECT pg_terminate_backend(pid);
- Restart the n8n container to clear any in‑memory locks.
- If you encounter any n8n cascading failures resolve them before continuing with the setup.
7. Webhook Triggers vs Scheduled Triggers — Different Stuck Behaviour
Not all stuck executions behave the same way. The trigger type determines both how the execution gets stuck and which fix applies.
7.1 Webhook-Triggered Executions Stuck in Queued
The specific problem: When a webhook triggers a workflow in queue mode, the main n8n instance must hold the HTTP connection open and wait for the worker to complete the execution before it can send the webhook response back to the caller. If the worker is slow or the queue is flooded, the calling service receives a timeout — but n8n still has the execution sitting in “Queued”.
The log entry you’ll see:
Error with Webhook-Response for execution "XXXX": "The execution was cancelled"
The execution was cancelled
Fix for webhook-triggered workflows: If the webhook caller doesn’t need an immediate response, switch to “Respond Immediately” mode in the Webhook node settings. This releases the HTTP connection right away, and the worker processes the execution independently. The queue can no longer cause caller-side timeouts.
# In the Webhook node → Response Mode → set to "Immediately"
# This tells n8n: respond 200 OK to the caller immediately,
# then continue processing the workflow async in the worker.
7.2 Scheduled (Cron) Executions Stuck in Queued
The specific problem: A cron workflow runs every 5 minutes. If the first run takes longer than 5 minutes (hits the concurrency limit or gets stuck in the queue), the second cron trigger fires and also enters “Queued”. You end up with a cascading queue of the same workflow.
Fix: Enable the “Deactivate workflow after execution” option or use n8n’s built-in concurrency controls. At minimum, set Execution Order to Single in the workflow settings to prevent concurrent runs of the same cron workflow.
8. n8n Cloud vs Self-Hosted – Fix Paths Are Different
The fixes in this guide apply primarily to self-hosted n8n. If you’re on n8n Cloud, several of the low-level approaches (Redis flush, SQL update, worker container management) are not available to you.
| Fix | Self-Hosted | n8n Cloud |
|---|---|---|
| Stop execution via UI | ✅ Works | ✅ Works |
| Stop execution via API | ✅ Works | ✅ Works |
| Restart worker container | ✅ Full control | ❌ Not available – contact support |
| Flush Redis queue | ✅ Via redis-cli | ❌ Not available – contact support |
| Direct SQL update on execution_entity | ✅ Full DB access | ❌ Not available |
| Deactivate + reactivate workflow (forces re-registration) | ✅ Works | ✅ Works – often resolves cloud Queued issues |
| Tune concurrency / queue env vars | ✅ Full control via .env | ❌ Managed by n8n – contact support for limits |
n8n Cloud users: If executions are stuck in “Queued / Starting soon” and the deactivate/reactivate workaround doesn’t help, reach out to n8n support via the in-app chat with your execution IDs and the workflow ID. Cloud infrastructure issues (worker pool exhaustion, Redis latency spikes) are resolved on their end.
Bottom Line
Detecting stuck executions is a must‑have for production‑grade n8n installations. By combining native metrics, a purpose‑built detector workflow, and optional external monitoring, you achieve zero‑downtime confidence that every workflow either completes successfully or is automatically terminated and reported. Implement the checklist, tune thresholds to your workload, and eliminate silent failures before they impact users.